06 May MARKET UPDATE: ALL ABOUT INTEREST RATES
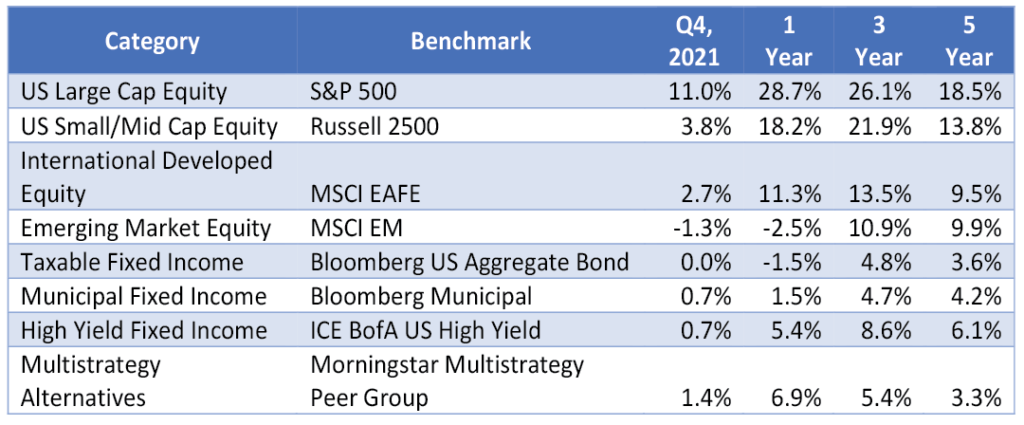
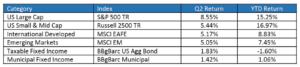
Equity markets continued their advance throughout the 1st quarter of 2024 as the rally that started in October of last year extended. The S&P 500 was up 10.56% in the 1st quarter, and up 28.5% since October, 27th of 2023. If you recall, this market rally was kicked off by the US Federal Reserve indicating that they were at the end of their rate hiking cycle and signaling up to three rate cuts by the end of 2024. While equity markets rallied across the board on this move, the start to this year has not been created equal for all markets. US small cap stocks were up 5.18% in Q1, international developed stocks were up 5.93% and Emerging Markets were up just 2.44%.
Fixed income markets saw volatility throughout the quarter. While they experienced a similar rally to equity markets in Q4 of last year as the Fed pivoted their policy stance, the start of this year has been negative for fixed income markets. The Bloomberg Aggregate Bond index was down -0.78% in the quarter, global bonds were down -2.08%, and municipal bonds were down -0.39%. The only positive performance within fixed income was from high yield bonds, whose higher correlation with equity markets led to some price appreciation during the quarter.

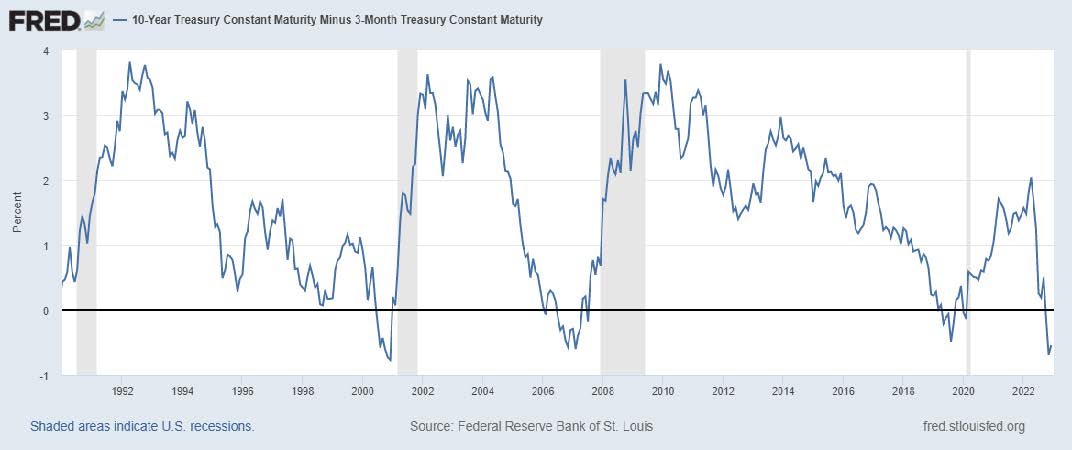
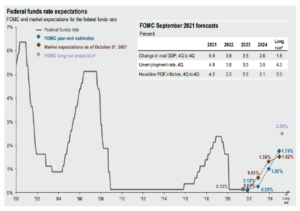
Markets have generally been driven by interest rate expectations over the last five months. The Fed’s signal towards cutting interest rates in 2024 was generally well received by the market. However, markets continued to price in cuts to a level above and beyond what the Fed had signaled. Early in the 1st quarter, the federal funds futures market had priced in up to six rate cuts this year.
We believed the public markets got too far ahead of the Fed at that point. We continued to keep our portfolios in a position that would be less sensitive to changes in interest rates as we believed the market needed to come closer to the Fed’s indication. If the markets were correct, and we received six rate cuts this year, we would expect a significant economic event to take place that would force the Fed to aggressively support the economy in short order. However, the underlying employment picture remains strong, and inflation remains at elevated levels (relative to the Fed’s inflation target). This equation simply would not add up to six, and possibly not even three, rate cuts in 2024.
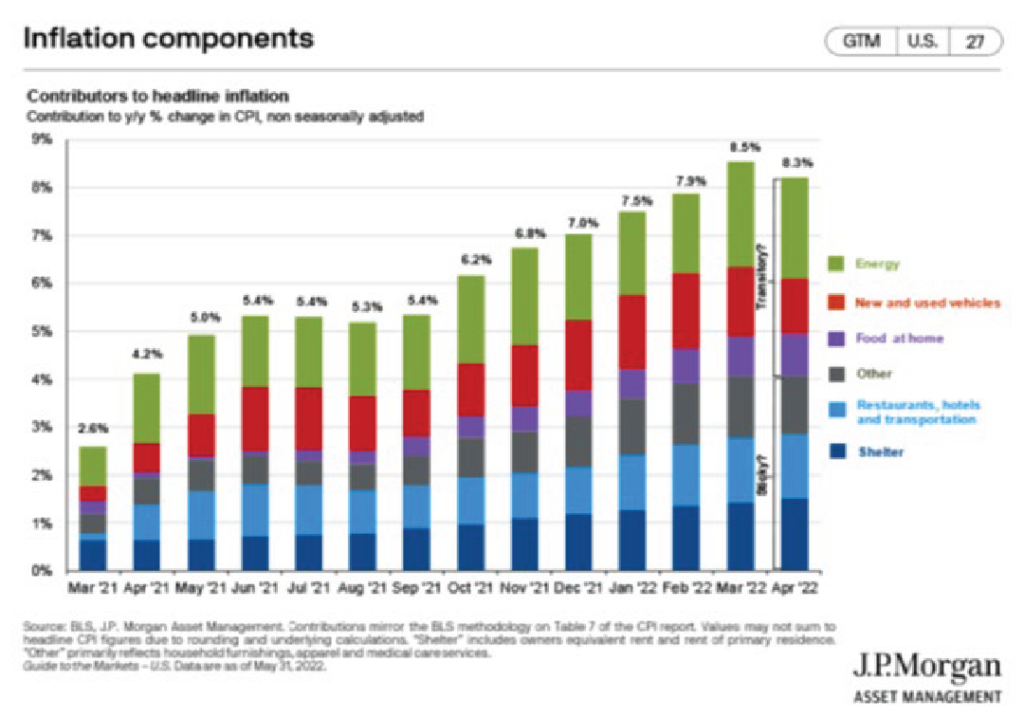
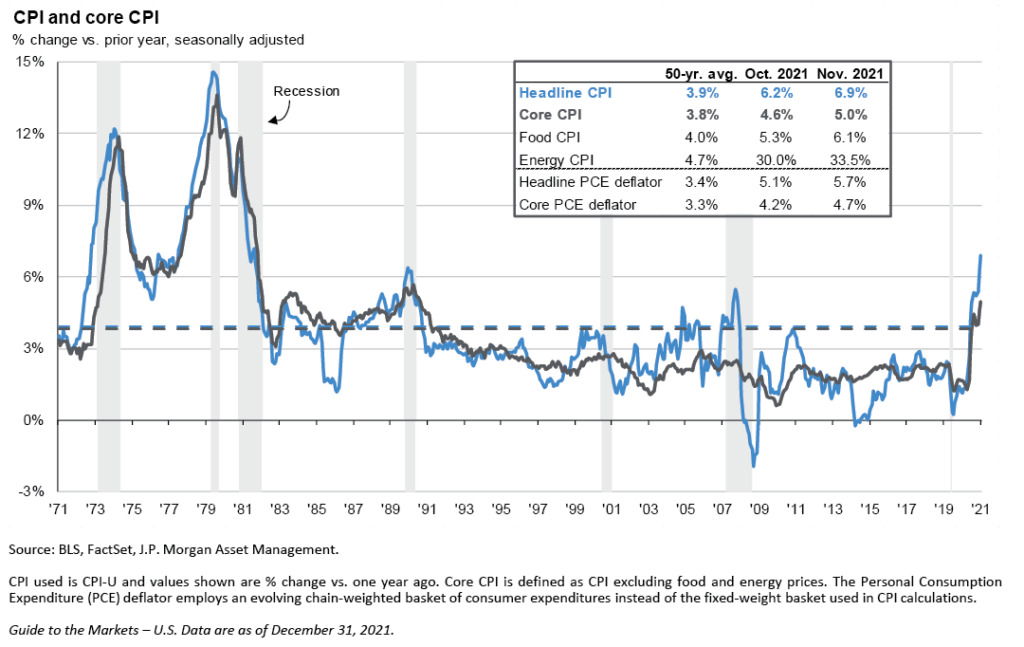
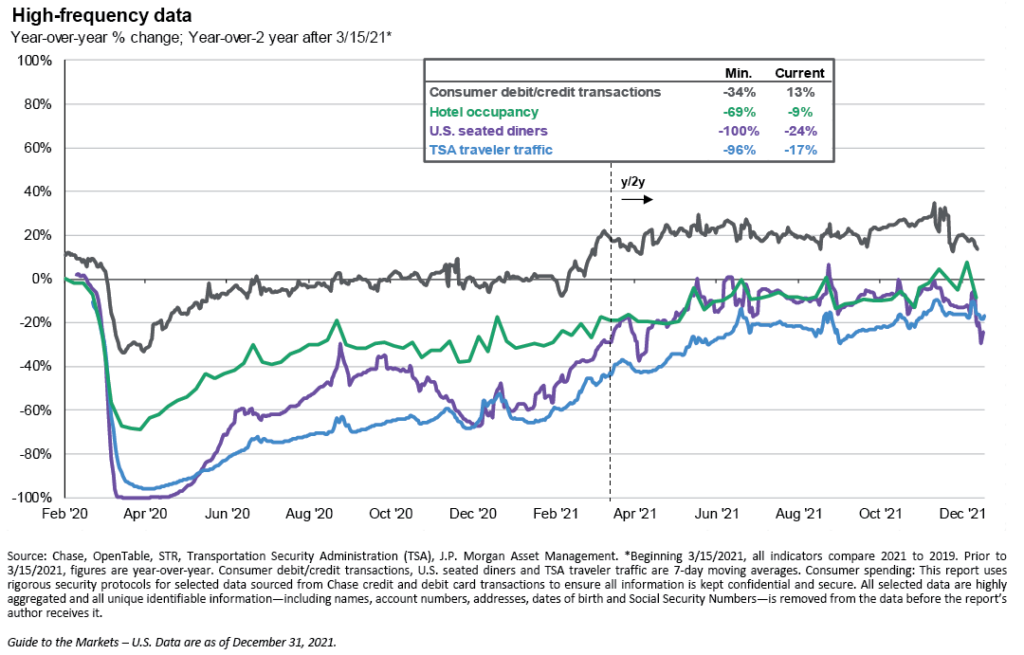
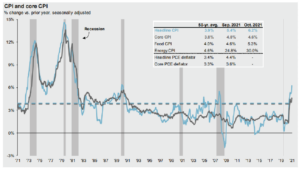
Our focus continues to be on the inflation numbers. Remember when inflation was described as “transitory” back in 2021? We are a long way from that and transitory has extended into a multiyear battle with the Fed pulling out all the stops to try to bring inflation back down to its 2% long term target. While progress has been made, inflation continues to sit between 3-4%, with the most recent CPI reading coming in at 3.5%. The numbers have been closely scrutinized, with many indicating the sticky shelter component of the inflation report as the culprit for higher readings for longer. The fact of the matter is, the economy is strong, and inflation will continue to be higher if demand continues to be present. We saw strong retail sales numbers in March, home prices continue to be sticky, and energy prices are once again on the rise. We don’t expect the inflation readings to be at the Fed’s 2% target any time soon under these conditions. Below is the expected path for core inflation over the next year given various monthly changes in the price index (which has been growing at about 0.3% per month on average over the last 6 months):

Where does this leave us for the remainder of 2024? A strong economic backdrop, robust corporate earnings, and a pivoting fed should mean all systems go. That being said, we have learned over the last several years that the market does an incredible job at pricing in events extremely quickly, and with the strong, rate-driven market rally over the last 5 months, it seems like most of the good news has been largely priced in. The start of the second quarter has not been as friendly to equity markets as participants start to readdress expectations in light of evolving fundamentals.
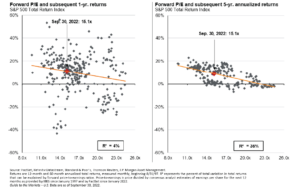
- As we enter the second quarter, equity market valuations are elevated relative to historical averages across the board with the highest valuations coming from the large cap growth space. Since the start of the new quarter (through 4/19), US Large Cap stocks are down -5.4% (with growth stocks down -6.15%). US small caps are down -8.29%, international markets are down -4.1%.
- Fixed income markets were pricing in as many as six rate cuts this year early in 2024. As of 4/19, markets are now pricing in just one cut this year. This is a significant change, and while the probabilities for the end of this year are wide, the highest probability is just one cut (even lower than what the Fed has indicated for 2024).

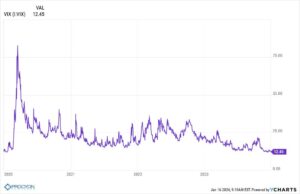
We expected this year to be volatile across the public markets. The lack of volatility over the past 5 months is not normal. It has been a steady climb since October 27th of last year. Market pullbacks are healthy for long term market efficiency as it gives investors and companies a chance to catch their breath – you can’t sprint your way through a marathon. We have been cautious in our investment approach this year as the market performance drivers have been narrow since last October.

More specifically as it relates to the public equity markets, we have steered away from the obvious higher- valuation names within the market and remain underweight to some of the tech names that have led this market higher.
We have focused more on some markets that we view as undervalued – small cap stocks continue to present a nice entry point for long term investors, international stocks present nice value opportunities, and even within US large caps there are some underappreciated companies that we focus in on.

On the fixed-income side, we have been keeping a close eye on the average maturity, credit quality and duration of our portfolio relative to our benchmark. As market participants aggressively priced in the growing potential for rate cuts, we shortened our duration (limiting our sensitivity to interest rate increases) as we expected rates to find an equilibrium at a level more in line with what the Fed had indicated. We have also since added duration as rate cut expectations have decreased and fallen closer to the Fed target.
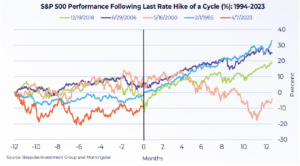
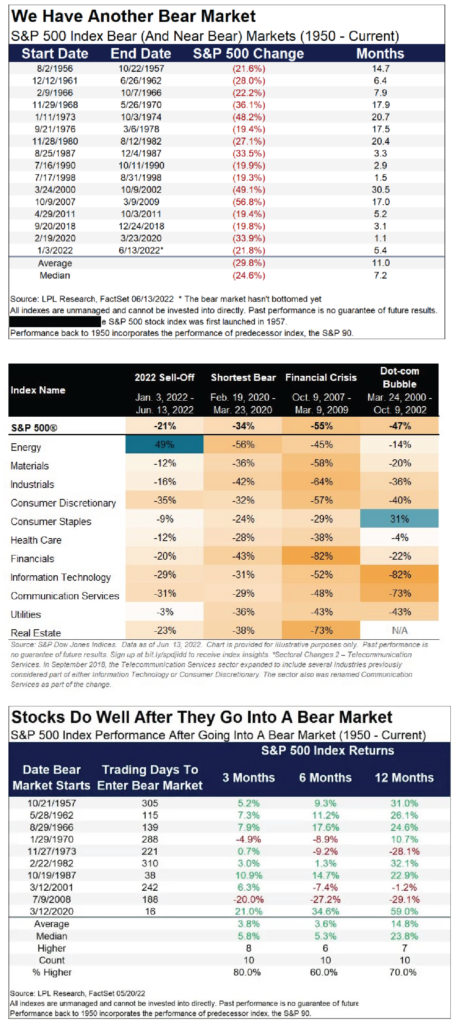
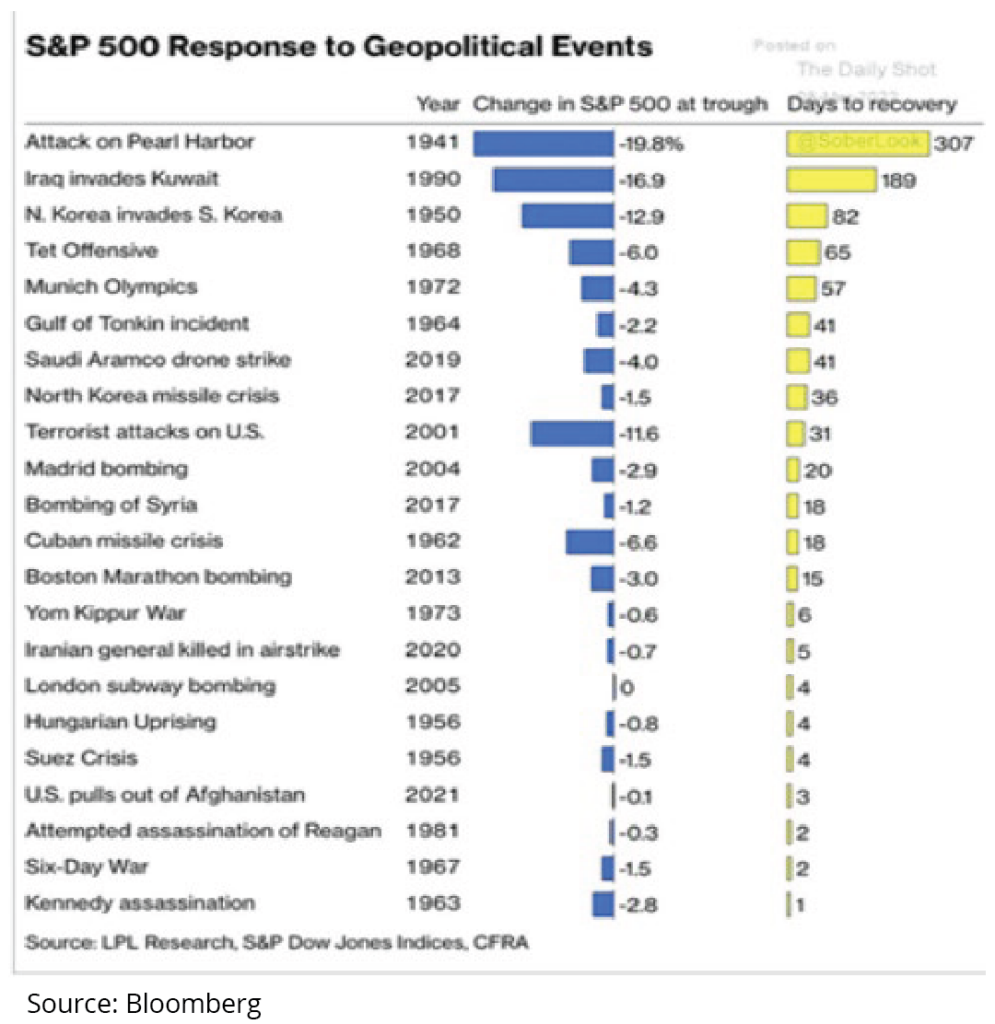
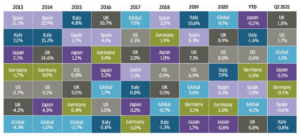
What’s next for 2024? We continue to expect market volatility throughout the second, and perhaps third quarters of this year. The ever-escalating events that have transpired between Iran and Israel over the last couple of weeks and months have increased this belief. The looming US Presidential election will also undoubtably drive some market volatility as we get closer as well. Historically a divided government between the White House and Congress has the most statistically significant impact on markets in the 3 months following the elections as shown here:

However, all our collective experience and rigorous study has strengthened a core belief that investing based solely on potential political outcomes or the fear of geopolitical events is not a reliable investment strategy over the long run. We continue to focus on fundamental measures of sustainability and value, including free-cash-flow, revenue and earnings growth, balance sheet quality, and executive leadership. Fundamentally we remain confident in the underlying macro-economic picture. As the volatility unfolds, we will add to equity allocations opportunistically, and prudently across market sectors we see as driving performance in the coming year.
IMPORTANT DISCLAIMERS AND DISCLOSURES:
The information contained in this presentation has been gathered from sources we believe to be reliable, but we do not guarantee the accuracy or completeness of such information, and we assume no liability for damages resulting from or arising out of the use of such information. Past performance is not indicative of future results.
The views expressed in the referenced materials are subject to change based on market and other conditions. This document may contain certain statements that may be deemed forward‐looking statements. Please note that any such statements are not guarantees of any future performance and actual results or developments may differ materially from those projected. Any projections, market outlooks, or estimates are based upon certain assumptions and should not be construed as indicative of actual events that will occur. The information provided herein does not constitute investment advice and is not a solicitation to buy or sell securities.
Different types of investments involve varying degrees of risk, and there can be no assurance that the future performance of any specific investment, investment strategy, investment model, or products, including the investments, investment strategies or investment themes referenced herein, will be profitable, equal any corresponding indicated historical performance level(s), be suitable for a particular portfolio or individual situation, or prove successful. Due to various factors, including changing market conditions and/or applicable laws, the content may no longer be reflective of current opinions or positions.
Please note that nothing in this content should be construed as an offer to sell or the solicitation of an offer to purchase an interest in any security or separate account. Nothing is intended to be, and you should not consider anything to be direct investment, accounting, tax, or legal advice to any one investor. Consult with an accountant or attorney regarding individual accounting, tax, or legal advice. No advice may be rendered unless a client service agreement is in place.
Procyon Advisors, LLC is a registered investment advisor with the U.S. Securities and Exchange Commission (“SEC”). This report is provided for informational purposes only and for the intended recipient[s] only. This report is derived from numerous sources, which are believed to be reliable, but not audited by Procyon for accuracy. This report may also include opinions and forward-looking statements which may not come to pass. Information is at a point in time and subject to change.