“A SMOOTH SEA NEVER MADE A SKILLED SAILOR” – FRANKLIN D. ROOSEVELT
For many of us up North, October represents a time of change as we prepare for the chillier weather to take hold, the leaves to start falling from the trees, and preparations for the holiday season begin. In the financial markets, however, October felt like a return to what we have grown accustomed to over the course of the year. Low volatility and equity market strength has characterized this market for much of 2021 and, after a small dip in September, we saw much of the same in October.
Equity markets broadly moved higher within the month with domestic equity markets posting the strongest performance of the major equity asset classes. International markets, while underperforming domestic equity in the month, were positive as well. Emerging market equity is still down on the year, however, as China (which makes up approximately 40% of the benchmark) has weighed down the broader index performance. Growth and value continue to be an attention-grabbing subject line as they have flipped and flopped all year, with value style equities leading the way early and growth style outperforming more recently.
Fixed income markets were slightly negative in October and remain mixed year to date. Taxable fixed income has trailed municipal fixed income year to date as exposure to treasury markets has been a headwind. Interest rates moved slightly higher throughout the month and have trended higher throughout the year as a whole.
|
Benchmark |
Category |
October |
Year to Date |
Trailing 1-Year |
Since Pandemic Lows (3/23/2020) |
| S&P 500 | US Large Cap Blend | 7.01 | 24.04 | 42.91 | 111.10 |
| Russell 2500 | US Small/Mid Cap Blend | 4.90 | 19.41 | 49.43 | 137.84 |
| MSCI ACWI Ex USA | Foreign Diversified Equity | 2.39 | 8.43 | 29.66 | 79.95 |
| MSCI EAFE | Intl Developed Equity | 2.46 | 11.01 | 34.18 | 79.21 |
| MSCI EM | Emerging Market Equity | 0.99 | -0.27 | 16.96 | 73.00 |
| Bloomberg Commodity | Commodities Broad Basket | 2.58 | 32.46 | 43.94 | 66.89 |
| Bloomberg US Agg Bond | Taxable Fixed Income | -0.03 | -1.58 | -0.48 | 4.72 |
| Bloomberg Municipal | Municipal Fixed Income | -0.29 | 0.50 | 2.64 | 14.46 |
| ICE BofA US High Yield | High Yield Fixed Income | -0.18 | 4.49 | 10.74 | 39.64 |
| Morningstar Multistrategy Category | Alternative – Multistrategy | 0.91 | 6.25 | 11.60 | 22.46 |
This has had a direct negative impact on treasury markets and has been reflected in the asset class returns year to date. Municipal bond markets have remained resilient in the face of these increasing rates as a strong demand for these securities amidst talks of additional spending and tax increases have helped municipal bonds outperform taxable year to date. High yield markets have had a strong year as well. While these securities tend to be more sensitive to changes in interest rates, a narrowing spread has led to positive performance.
Finally, if you tuned into our 3rd quarter investment committee webinar, we discussed alternative investments at length and how they may fit within a portfolio specifically as an uncorrelated return source. The universe of diversified liquid alternative strategies was up during the month and is positive year to date.
Earnings:
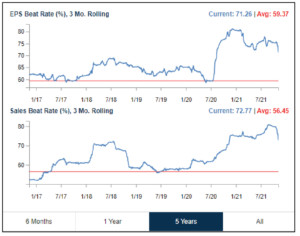
October returns have been driven by Q3 earnings (among other catalysts) which continue to be historically strong. The 3-month rolling earnings beat rate currently sits at 71%, nearly 12 percentage points higher than its historical average. Revenue beat rate has been equally as impressive lately, with 73% of companies posting a sales beat on a rolling 3-month basis, again, well above historical averages. It is worth noting that both of these numbers have been falling recently as companies have continued to adjust their estimates coming out of the pandemic environment. While these earnings and revenue beats have helped boost the market, more companies have issued negative guidance this quarter than in previous, and negative earnings guidance has outpaced positive. This is worth watching as companies try to balance supply chain issues with their future growth opportunities.
Valuations:
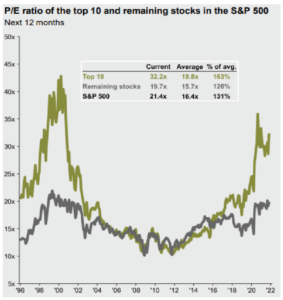
As the markets have continued to move higher, valuations have continued to look broadly unattractive on paper. The S&P 500 is currently showing a forward price to earnings ratio (P/E) of 21.40x, well above the 25-year historical average of 16.80x, indicating that you have to pay more of a premium for earnings in today’s environment. Additionally, valuations domestically look expensive across all market capitalizations when comparing today to historical averages. However, we believe that this is a time to be selective in your equity allocation rather than shying away due to valuations. Here are a few items to note:
-
- When comparing equities to fixed income, equities look more attractive from a valuation standpoint. Despite interest rates being at a lower level overall, the market is incredibly rich and a lot of those securities are trading at even higher valuations than what we are seeing in the equity markets.
- The spread in valuations remain Said simply, companies with the highest valuations are trading at an extreme premium while the companies with lower valuations remain around historical averages.
- The valuation on the top 10 stocks in the S&P are significantly elevated relative to the remaining stocks in the The top 10 stocks have an average P/E of 32.2x while the remaining stocks in the index have an average P/E of 19.7x. This is highlighted in the chart to the right.
- International markets continue to trade at a significant discount relative to domestic equity While this is true historically, this discount is usually in the ballpark of about a -13% discount. Today the discount is closer to -27%.
Economic Growth:
Following two strong quarters of GDP growth at the start of the year, slowing consumer spending combined with larger-than-expected effects from the Covid-19 Delta variant caused a series of downward revisions to the 3rd quarter GDP estimate prior to it being released in October. These reduced estimates turned out to be accurate as 3rd quarter GDP growth came in at 2.0% annualized compared to the 1.9% estimates. The market broadly shook this off since that number had been priced in throughout much of the previous month. Looking beyond 2021, the Conference Board forecasts that the US economy will grow by +3.8% year-over-year (YoY) in 2022 and +3.0% YoY in 2023. This would represent real GDP growth above the +2% trend we have seen since the turn of the millennium.
The Federal Reserve:
While economic growth is what we are looking for at the end of the day, there are many inputs that go into that number that we monitor monthly to evaluate whether those growth expectations can be met. As many are aware, the Federal Reserve (Fed) operates with a dual mandate of stable prices and full employment, as they believe managing these two factors will lead to long
term growth for the economy overall. The employment picture continues to improve, albeit at a slower pace than anticipated coming out of the pandemic. In October, the unemploy- ment rate edged lower to 4.6% with job growth seen across a multitude of economic sectors.
However, the labor force participation rate remains short of pre-pandemic levels, sitting at 61.6% as of October. At the same time job openings are
sitting near an all time high, at just shy of 10.5 million jobs. Many employers have highlighted the lack of workers in industry surveys, contributing to some of the supply chain disruption we have seen throughout the year.
Supply chain issues have been one of the major drivers of higher inflation which has taken hold this year after years of inflation recording in the 0-2% range. While each industry is experiencing their own microeconomic supply chain frictions, the macroeconomic issue has to do with the overall flow of goods throughout the economy. As a direct result of the pandemic companies are looking to bolster their inventories in the near term as many were caught running too lean when consumer demand came back stronger and faster than expected. This has resulted in an enormous influx of shipments into US ports and a backlog of cargo ships waiting off our shores. In the simplest form, we can look at those ports and come to a conclusion that they must not have enough workers to unload these ships. However, when digging deeper it becomes clear that the ports do not have the warehouse space to ease the bottleneck. Simply put, the strong demand from the consumer has led to a significant influx of goods into the US and there are simply not enough shipping companies to support the flow of goods. Add onto this the fact that oil prices have continued to move higher throughout the year, contributing to higher shipping and input costs. All of this has led to an October inflation reading of 4.6% when you exclude food and energy prices, which tend to be more volatile (this is the Fed’s preferred measure).
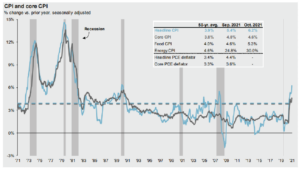
When accounting for higher food and energy prices, the average American is seeing prices which are roughly 6.2% higher than last year.
So where does this leave us? Well, it leaves us in the hands of the Federal Reserve, who hold the master key to this puzzle. When it became apparent that inflation was likely to increase from recent levels, the Fed made a key change to its mandate to target an “average of 2% inflation” rather than an explicit 2% target. This gave wiggle room to be flexible with their policy decisions and allowed them to label inflation as “transitory”. This term has been scrutinized as it implies that it will be short lived. Chairman Powell has had to adjust his stance and clarify that, according to the Fed, transitory means that higher prices have been caused by an event that is not sustainable, adding that we should expect inflation to stick around “longer than initially expected”. The significant demand that we have seen from the consumer, coming from a period of time where demand was very low, has caused a shock to many markets. This includes the housing market (which is seeing YoY prices increase nearly 19.9% as measured by the Case-Shiller Home Price Index), the auto market (with used car prices up 26.4% YoY and new car prices up 9.8% YoY), the energy market (up 30.0% YoY), and others. Some of these prices will subside as demand normalizes and supply chain bottlenecks get worked out, while others may stick around for longer. While this remains to be seen, it will be worth watching will be how 1- inflation makes its way though companies balance sheets, 2- which companies will easily be able to pass through costs to the consumer, and 3- if higher prices lead to wage inflation (which could be a catalyst for more persistent higher inflation).
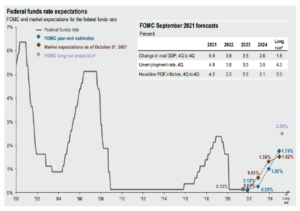
This brings us back to what we said above, the Fed holds the master key. Inflation is a byproduct of a strong economy that is running hot. While monetary policy (the Fed’s tools to control the money supply) has been easing since the pandemic, a strengthening labor market, continued economic growth, and hotter inflation open the door for the Fed to start tightening their policy stance. This will happen in a couple of stages, outlined by the Fed Chairman a week ago. First, they will start scaling back their bond-buying stimulus program (a policy put in place to provide liquidity during the pandemic, commonly known as quantitative easing) starting later this month and likely ending sometime in mid-2022. From there, the Fed will start to look to raise the federal funds rate to further contract the money supply. The market is currently pricing in two rate hikes by the end of 2022.
Washington:
With election day casting a shadow of doubt over the Democrats’ policy efforts, there was some progress in early November on the fiscal policy front as President Biden scored a bipartisan infrastructure win. The $650 billion bill takes aim at traditional infrastructure projects, with funds allocated towards clean drinking water, high-speed internet, road/bridge repair, airport and port upgrades, and even electric vehicle charging networks. While this bill has been sent to the President’s desk for signature, the Build Back Better (BBB) plan seems to be in shambles as it has failed to gain support across the democratic party in its current form. Speaker Pelosi continues to push forward with attempts to pass the bill and plans on holding another vote in the coming weeks. With no support expected from Republicans, the package cannot lose more than three democratic votes to pass. While this is a big question in and of itself, the plan does not seem to have the support of the Senate either, with Sen. Manchin of West Virginia and Sen. Sinema of Arizona both voicing to objections to the proposal. House democrats have most recently demanded to see an assessment from the Congressional Budget Office projecting the costs and how far tax hikes will go to offset them. While the focus has been on Build Back Better, President Biden’s tax law changes are an underlying key component to funding the massive spending bill. With BBB’s outlook getting dimmer and dimmer, the odds that tax changes in their current form get pushed across the finish line are looking slim. It now looks like any increases will not be as substantial as initially expected.
What’s Next?
We started this commentary with a quote from Franklin
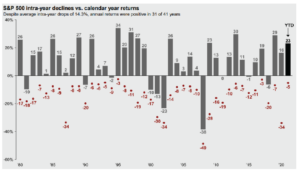
D. Roosevelt; “A smooth sea never made a skilled sailor”. Since the market lows on March 23rd of 2020, it has been an extremely smooth ride with the occasional bout of short-lived volatility. The largest pullback in the S&P that we have experienced year-to-date has been -5%. To put that in perspective, this is just the second time in the last 26 years in which the largest intra-year decline in the S&P was 5% or less.
Simply put, we have been extremely fortunate to have smooth waters over the course of the last 19 months and the market dynamics have supported this environment. Every now and then we have to pinch ourselves to remind us that this is a not a market that you experience every year.
With the supply chain issues that continue to persist in the economy, inflation running higher than what we are used to, stretched valuations in certain companies and industries, a likely tightening of monetary policy, and several items up in the air in Washington, the odds are high that next year will not look like the year we are currently experiencing. The Procyon Investment Committee is balancing these changing inputs on a daily basis and positioning portfolios not only for times of market strength, but for times of market weakness as well. As we march towards the end of the year and head into 2022, we will continue to adjust portfolio allocations to ensure we are in a position to benefit where possible.
Wishing you and your family a peaceful holiday season.
Procyon Partners