Happy 246th Birthday to the United States of America! Paraphrasing the incomparable Erma Louise Bombeck (1927- 1996): “You have to love a Nation that celebrates its Independence every July 4…with family picnics where kids throw Frisbees, the potato salad gets iffy, and the flies die from happiness. You may think you have overeaten, but it is patriotism.” And especially in the U.S. equity markets, June has generated considerable fireworks. Declining -8.4% in price in June and -20.6% for the first half of 2022, the S&P 500 index finished its worst first half performance in 52 years (in 1970; and it is worth keeping in mind that in the second half of that year, the S&P 500 generated a price gain of +27%).
For the 12 S&P 500 bear markets since World War II — excluding this year’s — the price decline has averaged -34% and the bear market length has averaged 10 months. If the current bear market adheres to this average performance, approximately 61% of the total damage has occurred, and approximately 70% of the bear market’s time duration has transpired.
The S&P 500‘s decline represents its fourth-worst first-half performance ever, only behind the price losses in 1932 (- 45.4%), 1962 (-23.5%), and 1970 (-21.0%). Also,
- Investors reacted to still elevated inflation readings; softening retail sales; slowing PMI services and manufacturing data; the Federal Reserve’s 75-basis point policy rate increase on June 15th; very gradual reopening signs in the pandemic lockdown in China; and back-and-forth news in the Ukraine
- In descending order, the June price performance of the 11 S&P 500 industry sectors was: Healthcare -2.5%; Consumer Staples -2.8%; Communication Services -6.2%; Utilities -6.2%; Real Estate -7.5%; Industrials -7.8%; Information Technology -8.2%; Consumer Discretionary -9.5%; Financials -10.3%; Materials-13.0%; and Energy -15.3%.
| Monthly and Year-to-Date Price Performance | |||||||||||||
| Index/Commodity | Jan. | Feb. | Mar. | Apr. | May | Jun. | Jul. | Aug. | Sep. | Oct. | Nov. | Dec. | YTD) |
| S&P 500 | -5.3% | -3.1% | +3.6% | -8.8% | 0.0% | -8.4% | -20.6% | ||||||
| Nasdaq Composite | -9.0% | -3.4% | +3.4% | -13.3% | -2.1% | -8.7% | -29.5% | ||||||
| Russell 2000 | -9.7% | +1.0% | +1.1% | -10.0% | 0.0% | -8.4% | -23.9% | ||||||
| Gold | -1.8% | +5.8% | +2.6% | -2.0% | -3.5% | -2.1% | -1.3% | ||||||
| West Texas Intermed.
Oil |
+16.8% | +8.6% | +4.8% | +4.4% | +9.5% | -7.8% | +40.6% | ||||||
| Source: The Wall Street Journal, and | Yahoo Fina | nce. July 1 | , 2022. | ||||||||||
As highlighted in the nearby price performance table, after a volatile trading month in June, the S&P 500 finished down -8.4% (3785.38 on June 30th versus 4132.95 on May 31st). The Nasdaq Composite registered an -8.7% decline in June, and the Russell 2000 index of small- and mid-cap companies fell -8.4% over the month.
Over the course of June, West Texas Intermediate crude oil prices declined -7.8%, from $114.67 per barrel on May 31st to $105.76 per barrel on June 30th. The global oil demand continues to reflect signs of China’s Covid-19 lockdowns easing; slowing momentum in the global economy; fuel shortages; low levels of inventories and spare capacity limited to a few countries; and precautionary buying, while supply is impacted by :
- the four-month Russia-Ukraine conflict continues to create significant demand and supply disruptions;
- several nations, especially the U.S. and including certain allies, have launched the release of crude oil from their respective strategic reserves
- consolidating S. shale producers have not excessively increased output in reaction to higher crude prices (as shown in the nearby chart) and have followed production discipline and exerted capital spending restraint; and
- following the OPEC and non-OPEC ministerial meeting on Thursday, June 30th, the group (which includes Saudi Arabia, Russia, the United Arab Emirates, Kuwait, Iraq, and other countries) agreed to keep the rate of their monthly output increases at an agreed pace of 648,000 barrels per day in August of this year, with Saudi Arabia and the United Arab Emirates likely to account for most of the supply increases.
The next OPEC+ Ministerial Meeting is scheduled for Wednesday, August 3rd, when the organization is expected to decide on production quotas for September.
Inflation
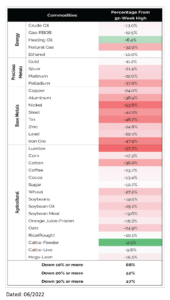
As a widely used input in the construction industry and in many manufacturing processes, so-called “Dr. Copper” is reputed to have a “Ph. D. in economics” because of the red metal’s perceived ability to foretell turning points in the global economy. The nearby chart shows that copper prices have exhibited a declining trend of late, perhaps reflecting lessening shortages, bottlenecks, and other supply-driven inflationary forces.
And copper is not the only commodity to have exhibited recent price weakness. As depicted in the nearby chart, versus their 52-week highs, numerous other commodities have declined to a considerable degree versus their 52-week highs in the energy, precious metals, base metals, and agricultural sectors.
These declines notwithstanding, their still-high absolute levels and especially, rising labor and occupancy costs have contributed to businesses’ and consumers’ elevated inflation expectations. These future price beliefs are monitored closely by the Federal Reserve to ascertain whether high inflation expectations are getting anchored in: (i) wage and salary expectations; (ii) consumers’ spending patterns, and (iii) corporate pricing behavior.
Monetary Policy and Interest Rates
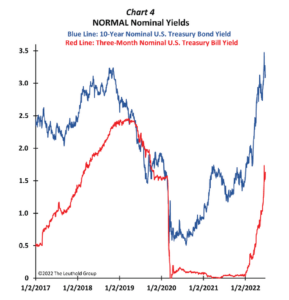
As shown in the nearby charts, following a significant interval of very low nominal yields throughout most of the 2020-2021 Covid-pandemic experience, short- and intermediate-term U.S. Treasury interest rates have risen significantly in 2022.
These increased yields have been in response to: (i) quickening U.S. economic activity; (ii) rising expectations of inflation; and (iii) increasingly restrictive monetary policy.
At the end of June, three-month nominal U.S. Treasury bill yields had risen to 1.69%, versus 0.06% on December 31, 2021, and 10-year U.S. Treasury yields had increased to nearly 3.50% by mid-June, up from 1.52% on December 31, 2021.
Following a 75-basis point increase on June 14-15 in the FOMC’s fed funds target monetary policy rate, to a 1.50%- 1.75% range, a number of FOMC voting members have been advocating for a second 75-basis point hike in the target fed funds rate at the upcoming July 26-27 meeting. If enacted, that would lift the target monetary policy rate to a 2.25–2.50% range by the end of July.
At this point, we are of the opinion that the Fed is likely inclined to continue monetary tightening in order to:
- slow inflation through (a) the direct effect of higher interest rates on the real economy, as well as through (b) asset price declines in the highly financialized S. economy;
- buttress the central bank’s inflation fighting credentials; and
- “store up” higher levels of policy interest rates in order to be able to stimulate the economy through interest rate cuts as recessionary episodes
The economy may continue to slow in response to:
- elevated rates of inflation crimping overall demand;
- continued increases in monetary policy interest rates; and
- Quantitative Tightening (monthly reductions in the Federal Reserve’s balance sheet, increasing from a $47.5 billion rate in June, July, and August to a monthly rate of $95.0 billion commencing September 1), our stance at this point is to remain flexible and data dependent, before beginning in the coming year to modestly add funds to longer duration fixed-income securities and to other beneficiaries of declining interest rates.
Economy and Corporate Profits
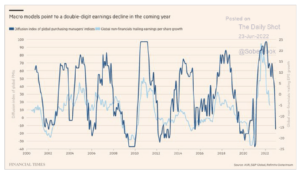
The IMF projects +3.7% real GDP growth for the U.S. in 2022 and +2.3% in 2023 (versus the FOMC’s median projection of +1.7% real GDP growth for the U.S. in 2022 and +1.7% in 2023). Also worth noting in the chart are significant slowdowns in World Output (+3.6% in 2022, versus +6.1% in 2021), as well as in the GDP of the Euro Area (+2.8%, down from +5.3% in 2021), China (+4.4%, down from +8.1% in 2021), Brazil (+0.8%, down from + 4.6% in 2021), Mexico (+2.0%, down from +4.8% in 2021), and South Africa (+1.9%, down from +4.9% in 2021). Against a backdrop of slowing Purchasing Managers Indices (Manufacturing, as well as Services), and possibly a recessionary GDP path unfolding, we are focused on the implications for corporate earnings per share results.
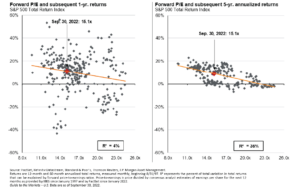
According to analysts’ estimates collected by I/B/E/S Refinitiv and tabulated by Yardeni Research, S&P 500 earnings per share are projected to grow +11.6% in 1Q22, +5.1% in 2Q22, +10.7% in 3Q22, and +10.0% in 4Q22, with full-year earnings growth projected to be +9.9% in 2022 and +9.7% in 2023. The nearby chart shows the possibility of downward revisions to earnings per share growth in the coming quarters and call for vigilant attention to be paid to Chief Executive Officers’ and Chief Financial Officers’ comments about the forward outlook on their companies’ earnings calls which will begin in the middle of July.
Our Team has further developed our scenario set to reflect the current environment:
| Scenario | Employment | Inflation | GDP |
| Base Case | Slightly higher as participation rate increases |
Peak Reached | Protracted Contraction Unlikely |
| Negative Case | Unexpected spike due to negative corporate earnings |
Peak is still in the future | Multi-quarter contraction continues |
| Positive Case | Participation goes higher with no uptick in UR |
Peak Reached and supply chains quickly resolve issues | Early 2022 contraction is an anomaly; GDP expands faster than EM in 2022/23 |
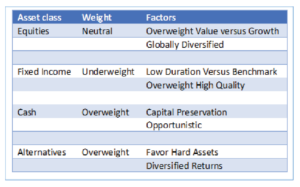
We will monitor these developments as they continue to unfold in the coming quarters. Given the risks that may lie ahead, here is a summary of our MACRO portfolio positioning as it stands within our committee.
The pockets of market and economic difficulty continue to come and go as the world continues to reshuffle after the shock of the pandemic shutdown more than two years ago. While this has persisted in some parts of the world, we are often reminded that we must move forward and deal with issues at hand through the institutions we’ve created. The mid-term elections are coming up fast and we will once again undoubtedly turn our eyes towards Washington in the coming months, thirsty for leadership in the face of inflation and divisiveness.
Procyon serves as a fiduciary to our clients, and making sure that each family, business, and individual is well looked after is at the heart of what we do. During these difficult markets we are prudently operating on your behalf, as well as those who rely on you for many years into the future. Please contact us if you have questions about how the current environment is impacting your investments.
Thank you for the trust you place in us.
Best Regards,
Procyon Partners